Hi there ! This is Gil.
I am here to warn you that my website stores data such as cookies to enable site functionality including analytics and personalization.
By using this website, you automatically accept that I am using cookies.
Full stack web application and services development. Focused on open source technologies. Including spatial intelligence into apps and web-based services.
Data Infrastructures
Design, development, implementation, maintenance and reengineering of data-based service-oriented architectures. DevOps to sharpen workflows.
Process Automations
Automations of data-driven process within any business and/or research environment. Implementation of ETL processes, data pipelines & AI.
Skills magnifier
Some of my most relevant technical skills visually magnified.
Web app development, automations, open source research for geospatial app development.
Research Studios Austria Forschungsgesellschaft mbH
October 2021 - March 2022
Assistant Lecturer
Tutoring MSc course in Spatial Data Infrastructures
Topics: Databases, interoperable data transport (GI standards), visualization.
Z_GIS - Department of Geoinformatics, Universität Salzburg
August 2020 - February 2022
Junior Researcher (Developer)
Machine learning for mobility data, geospatial web tools development and implementation.
Research Studios Austria Forschungsgesellschaft mbH
Education
Universität Salzburg
MSc in Applied GeoInformatics 2019-2022
Universität Salzburg
Minor in Data Science 2017-2018
Universitat de Barcelona
BSc in Geography (GIS) 2015-2019
With an interdisciplinary academic background combining information technologies, data science and geospatial vision. All together as a perfect mix to
develop technological solutions for the society and market. Analytical and global perspective from the geographical side. Technical, innovative and problem solving perspective
from the IT side.
Portfolio
In this section I exposed some of the work done throughout my master studies in GeoInformatics.
Master Thesis
WS 2021
i3 Project AI4Mob
SS 2021
Machine Learning for Social Good
SS 2021
IPs: SDI & Application Development
WS 2020
Intro to Data Science and Machine Learning
WS 2020
Internship
SS 2020
SE Analysis & Modeling
SS 2020
Practice: Software Development
WS 2019
Currently based in...
Contact
For any contact request, do not hesitate on contacting me through LinkedIn.
MSc Gil Salvans Torras
Development of infrastructure with automatic machine learning analysis of public transport delays in real time
Master Thesis
Project Abstract
This research aims to develop and implement an automated data infrastructure capable of predicting hourly bus delay patterns in the regional bus stops of the Alpenstrasse in Salzburg (AT). To do so, the convenient data streams are constantly retrieved, stored, processed, labelled and used as input for feeding the previously created and trained predictive models in an automatic manner. These models correspond to two support vector machines and two feed-forward neural networks; each one covering its classification function for the study case. On the client side, the user can access a web dashboard with the latest predictions referring to the following hour delay patterns.
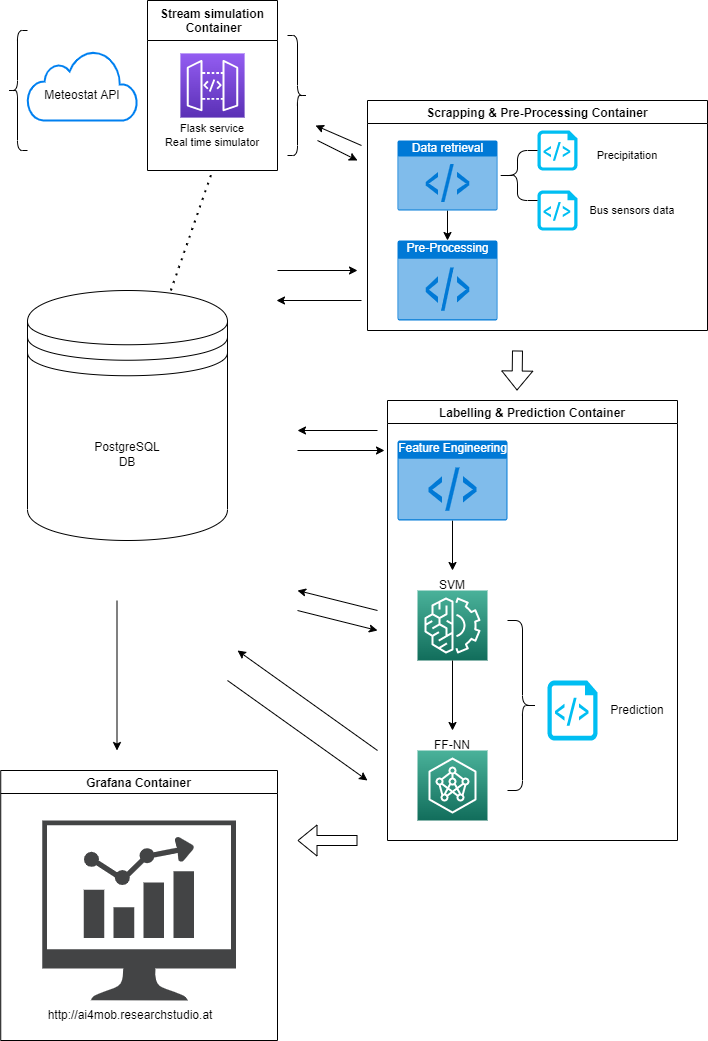
Architecture Overview
The general architecture of this infrastructure is as the diagram above shows, with four
distinguished tiers that are all brought together and interacting with the database. At first,
the data sources are defined and its data is hourly requested, parsed and stored in the
Postgres DB. Secondly, this raw data is cleaned and pre-processed with a desired structure
for this study case. Once this is done, the data is subject to labelling and enrichment by
creating all its features, which in other words, will be the predictors. Then, the models are
developed, trained and deployed into the production server. These classifiers (SVM &
FFNN) are imported by a prediction script which is in charge of making the next hour delay
predictions. Finally, the DB, with the tables and views of all these aforementioned
processes, is connected to the web dashboard and displaying the most up to date
predictions (next hour delay patterns).
In addition, as the diagram illustrates, each module of this data pipeline is containerized.
This technique, carried out with Docker, is done for smartening some development and
maintenance aspects, as well as for better practices. Having each module running in its own
container sharpens maintenance, debugging and update processes since each has its own
independent Linux environment. Additionally, the production server has multiple
applications and processes running from iSPACE as well as multiple users. Therefore, with
the entire infrastructure containerized, if for instance any configuration change or deletion
in the server is done, it is more likely that this infrastructure does not get affected (e.g. file
deletions, mistaken DB modifications, processes configuration changes…). Besides all these
exposed aspects, Docker is also a very handy and practical for DevOps processes. For
example, if the app gets once in a while updated, with tools like docker-compose, the
deployment process can easily be automated.
Results
Checkout all the thesis results (including documentation, metadata, code...) in the following Git Repository.
Additionally, the client-side results are publically deployed as a web dashboard.
Team: Gil Salvans Torras
Completion date: February 2022
Supervised learning for public transport delays prediction in Salzburg: A neural network approach
IP i3 Project
Project Abstract
Throughout the past years, the public transport sector has experienced significant technological improvements in several aspects.
From infrastructural changes, management and planning improvements or even technological changes on the
user side (e.g. Apps, monitoring…). In this sense, the mobility sector has been revolutionized and
keeps evolving towards a smart mobility paradigm. Following this line, this research focuses on the
implementation of Artificial Intelligence in mobility. Furthermore, it aims to build a data pipeline
to develop a neural network using public transport data in Salzburg. More specifically, this research
focuses on the predicting delay patterns per regional bus station within the entire city.
In other words, to predict what will be the delay magnitude per station in the next hour.
To do so, historic time-series data from the public transport and related relevant data sources will
be retrieved, stored, processed and analysed through machine/deep learning techniques.
In agreement with this, the predictive analysis will be carried out by a neural network,
which will be trained and deployed accordingly. From the client side, there will be a dashboard
web application running and universally accessible over the internet through any device with the
predicted results. Therefore, with such a predictive tool further implemented, the users will be able
to use this output to improve their mobility needs in their daily lives. From the mobility planning
and management side, the SVV (Salzburger Verkehrsverbund) will also take into account these
hourly-predicted results for further and future decision-making.
Case study and data
This research is focused on the city of Salzburg. This means that the data used and resulting predictions are based on this study area; regional bus stations within the aforementioned geographical extent. This area contains up to 88 regional bus stations, in which its hourly bus delay patterns are predicted. However, once the entire research is developed, this machine learning data pipeline can also be used with data from other districts, since the neural network is capable to detect bus delay patterns. The study area is just a simplification filter for this project, since its aim is rather the technical solution.
In terms of data, the main provider is the Salzburger Verkehrsverbund (SVV). Since it is a private company (GmbH), the provided data is private and according to this, only samples are shared in this research. Therefore, two main data sources from SVV are used and two additional open ones.
The first one consists of time series bus measurements data from January to April 2021. To be more specific, this data source contains over 3 million records. Each record refers to a regional bus reaching a bus station and sending a data package to the server accordingly. In each measurement (record) there are several parameters included such as the date, time, line, driver, license plate, etc. –see further info in the metadata -. This first data source is the main and key input for the machine learning operations.
The second dataset used includes the geometries of the regional bus stations of the entire province of Salzburg. This is very important for the results visualization, since the bus measurements data is also georeferenced but has significant errors (15-20 m errors). According to this, this second dataset gives an optimal spatial precision to visualize the results.
Regarding the third dataset, which is open from the Austrian government data portal, it refers to the districts geometries. From these, the city of Salzburg area is selected and used to clip all the aforementioned SVV data.
Finally, the forth dataset is retrieved from Meteostat API. It is an open source API for all kinds of meteorological data all over the globe. In this case, precipitation data for Salzburg within the study time span (Jan-Apr 2021) is retrieved and accordingly stored. The aim of this retrieval is trying to find correlation between precipitation –as rain or snow- and delay patterns.
BPMN Model
Backend: Data & ML pipeline
The backend workflow and results can be checked out in the report, which is attached at the end of this page.
To see the code and Jupyter Notebooks, I have set up a public GitHub repository with all the contents -during the project GitLab was used-.
In the notebook, the deployed neural network model can also be found (as .h5). At this point, the accuracy was stuck at 84.1%. However,
this entire study case is being further developed and improved in the master thesis.
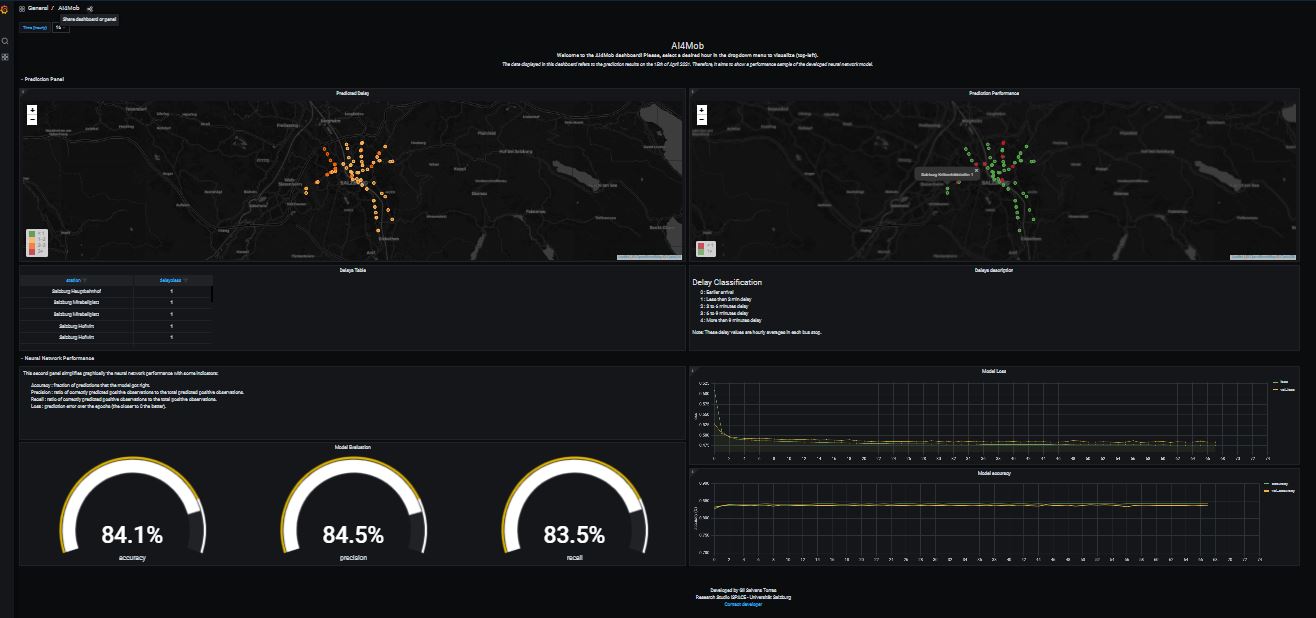
Frontend: Web Dashboard
The aim of this web dashboard is to give an overview of how the developed neural network model performs in the hourly delay prediction within the study area. The target audience should be users with some technical experience within data-related fields.
For further details, checkout the web dashboard under the following link: http:/ai4mob.researchstudio.at .
Team: Gil Salvans Torras
Completion date: June 2021
CODA
Final project from the courses IP SDI: Services Implementations & IP: Application Development.
CODA, standing for Covid-19 Dashboards, aims to, on the one hand, develop a Spatial Data Infrastructure (SDI) regarding the Covid-19 pandemic development in near real time for Austria, Germany, and Spain. On the other hand, this information should be put into public usage by developing an interactive dashboard, accessible via a browser.
The data is scraped daily from the three country data sources to serve the current situation in each of the aforementioned countries accordingly. Displaying the data in the dashboard, the user gets a quick and intuitive overview of the current pandemic situation in each specific country. Additionally, the different output dashboards will also help the users in their daily life decision making regarding their current personal health conditions and their daily routines.
In technical terms, the entire SDI architecture has been self-developed by the project authors; backend & frontend. On one hand, for the backend, the most important pillars are the data scraping, processing and storing, and the data sharing through OGC standard services. On the other hand, the frontend is led by the web application development which obviously retrieves interactively all the previous services and data.
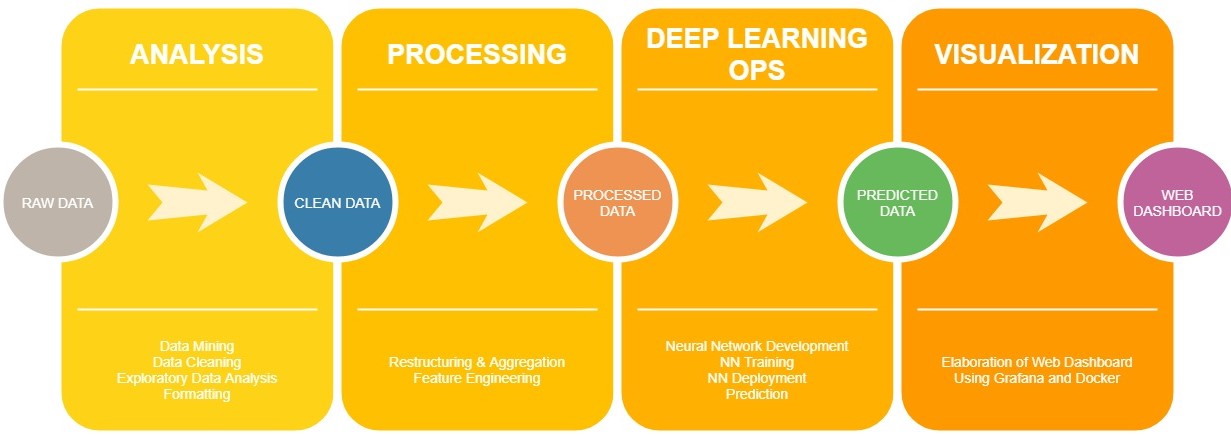
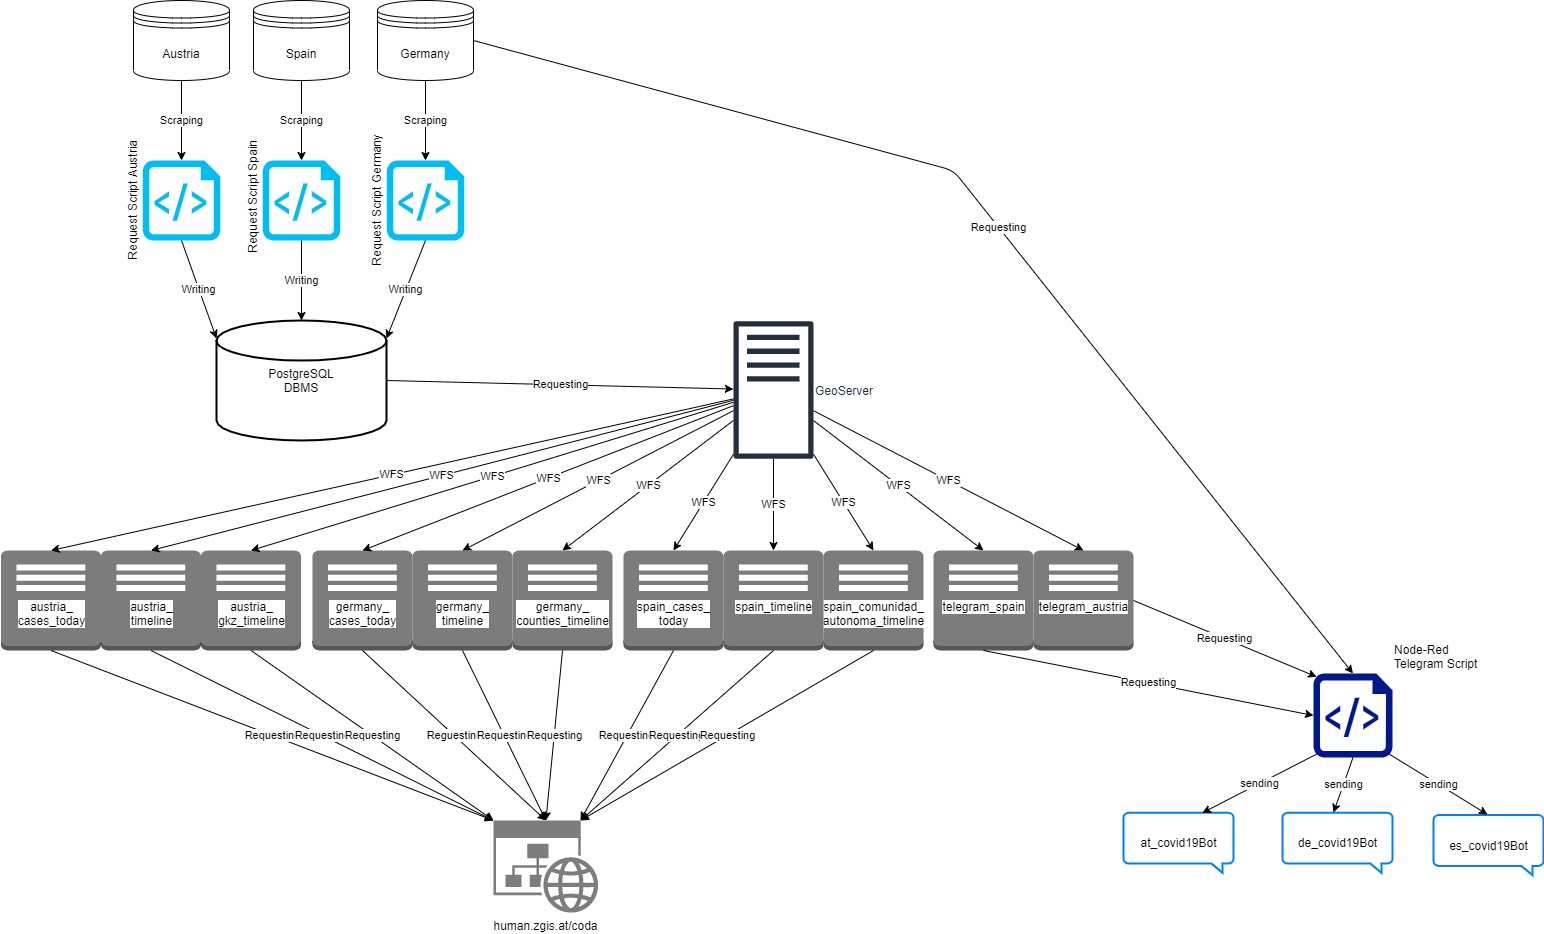
Architecture Overview
According to this architectural diagram, it can be subdivided into four stages:
1. Retrieving the data and writing the data into PostgreSQL-databases. This is done by using three different R-Scripts.
2. GeoServer, which is connected to the databases and generates the respectives WFS & WMS for the web-application.
3. The dashboard web-application which displays all the data in an interactive manner.
4. Node-Red, used to send out messages to subscribers via Telegram Bots.
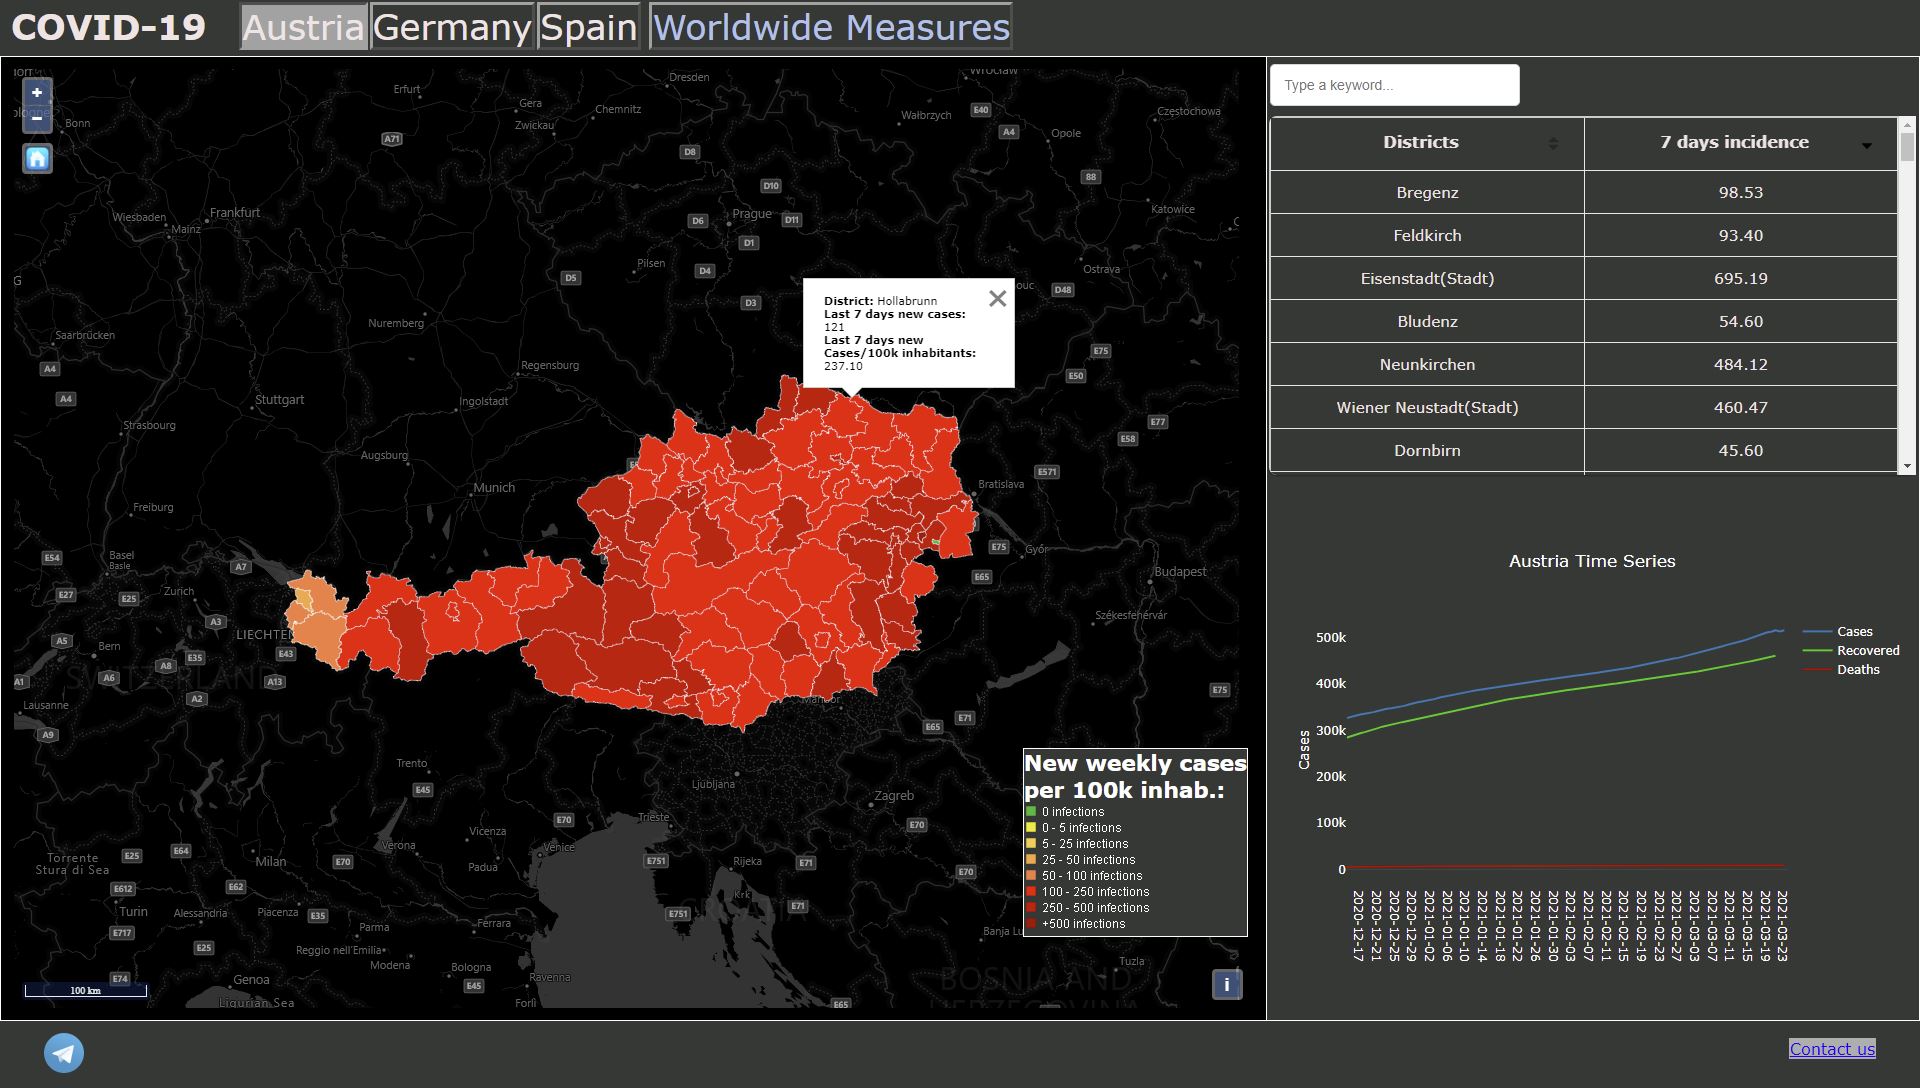
Web App Preview
The web application is composed of different interactive dashboards per each of the countries, worldwide measures dashboard and telegram bots. More specifically,
each of the country dashboards contains a web map displaying the latest Covid-19 data, a table (filterable and with a search bar) and a time series plot.
For Austria and Germany, the last seven days incidence is displayed in the respective maps, and for Spain –since the data quality is very variable- the current cases
are displayed. Pop-up interactions are also enabled in each map and for each clicked district, the time-series chart gets adapted to it and auto-scaled automatically.
For the worldwide measure's dashboard, it contains the latest Covid-19 measures and restrictions per country in a worldwide scale. Therefore, when the user clicks
on each country point, the right pannel information changes according to the latest info of the selected country.
In technical terms, the web application has been developed by using NodeJS (JavaScript server-side runtime environment) and Parcel to bundle all its modules.
Therefore, it has been deployed on a production server (Apache Tomcat 9) from the university to guarantee a universal access via internet.
Visit the CODA web application using the following link (UPDATE: some functionalities are already cut off from the server-side): http:///human.zgis.at/coda .
Team: Eike Sebastian Blomeier and Gil Salvans Torras
Completion date: February 2021
Internship
Company: Research Studios Austria mbH - Studio iSPACE
Department: Smart Settlement Systems
Role: Intern as GIS Developer/Programmer.
Period: March 2019 to July 2019
During my Internship period at iSPACE, I carried out a whole range of different tasks applying GIS Development and Spatial Data Science to public mobility
planning and management. Therefore, to give smart solutions to the public transport planning stakeholders. In my case, I focused
on the development of tools/software extensions to quantify the POIs (Points of Interest) and its influence to traffic demand & volumes in the State of Salzburg.
To do so, the following bulletpoints expose and describe the respective tasks:
1. Massive retrieving of POI data for the entire State of Salzburg (OSM, Land Salzburg, private sources...) and storing it all into a big PostgreSQL database (POI DB development).
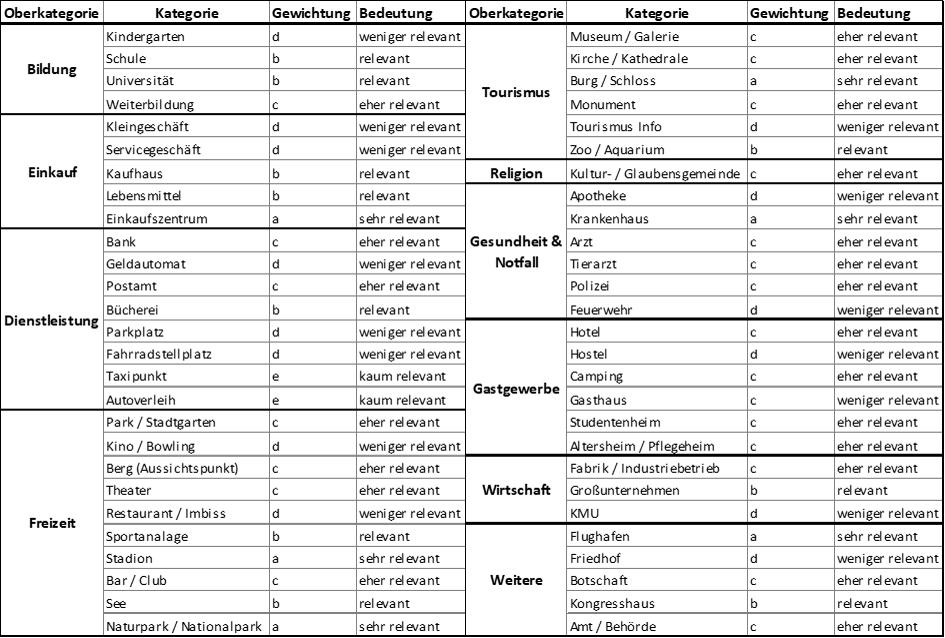
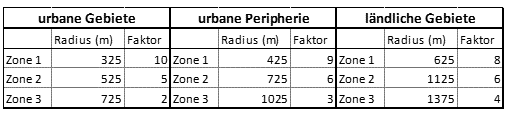
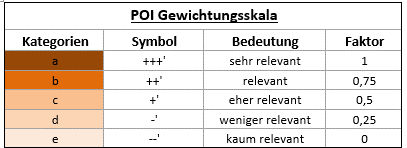
2. Elaboration of a weight matrix for the weighting of the different POI categories. See upcoming three tables. The first
one illustrates the POI categories selected and its weights. The second table shows the different weight multipliers depending on distance. The
third one referst to the POI weighting cheatsheet. Notice that the three tables are in German due to the fact that the project users are
Austrian stakeholders. However, the general idea can be easily understood.
POI categories selected and weighted.
Distance factors of the POIs according to Güteklasse (2017).
POI weight cheatsheet. Inspired by Mobility Integrator (2019).
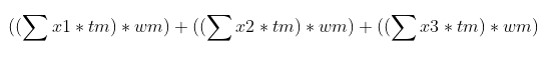
3. Creation of an indicator to assess and evaluate the POI potential (for mobility) per area:
Elaborated POI formula.
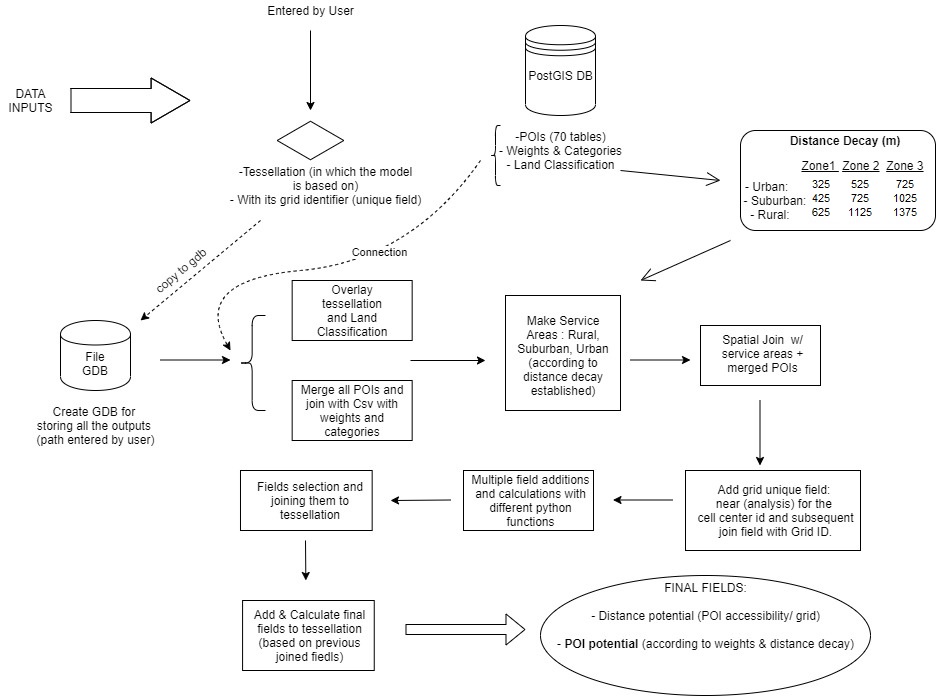
4. Development of a Python Tool, compliant with ESRI technologies, to calculate the POI potential of a given area within the State of Salzburg (or the entire province):
Workflow diagram of the first script tool.
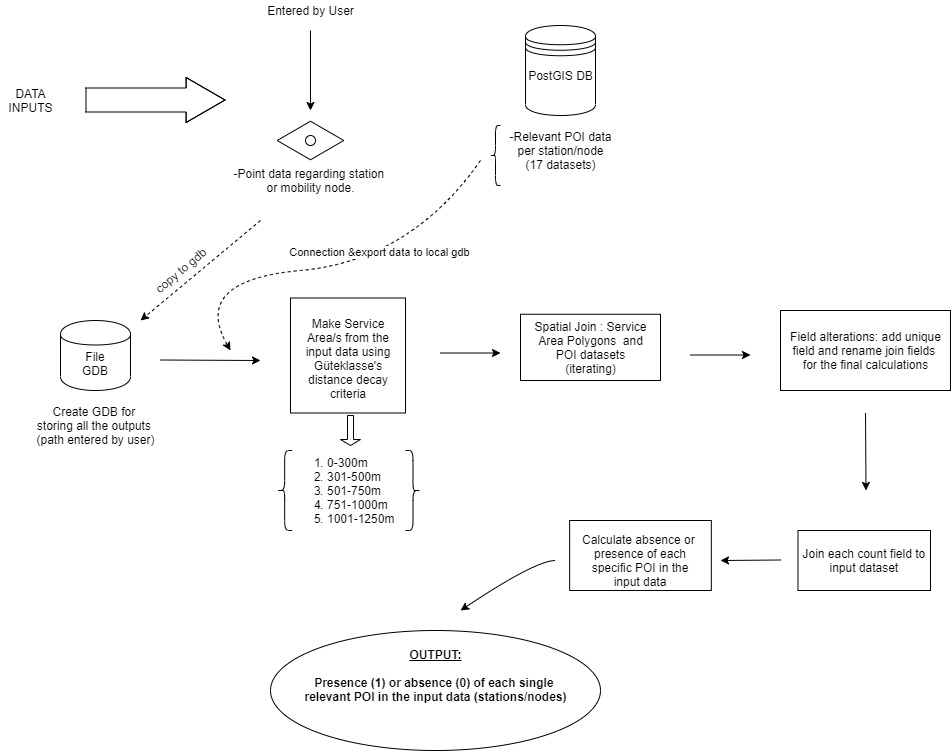
5. Development of a Python tool, compliant also with ESRI technologies, to detect what POIs are existing within each bus station cachement area in the State of Salzburg.
Workflow diagram of the second script tool.
Having shown the tool diagrams, these are some graphical outputs mapped:
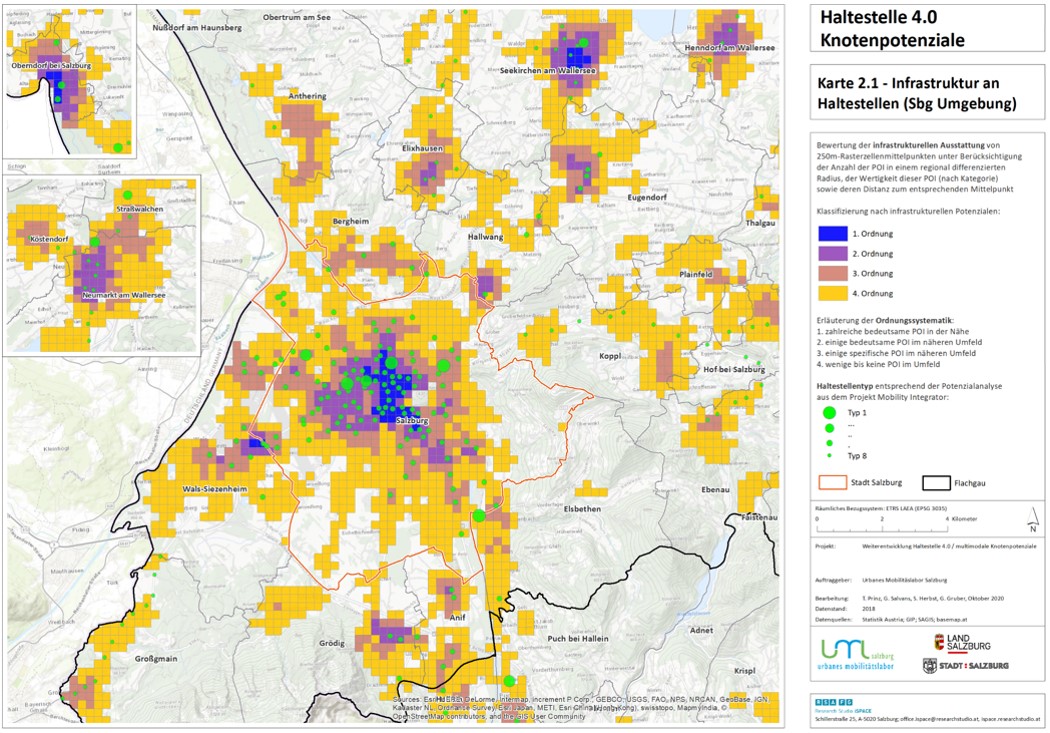
POI potential tool results on a map.
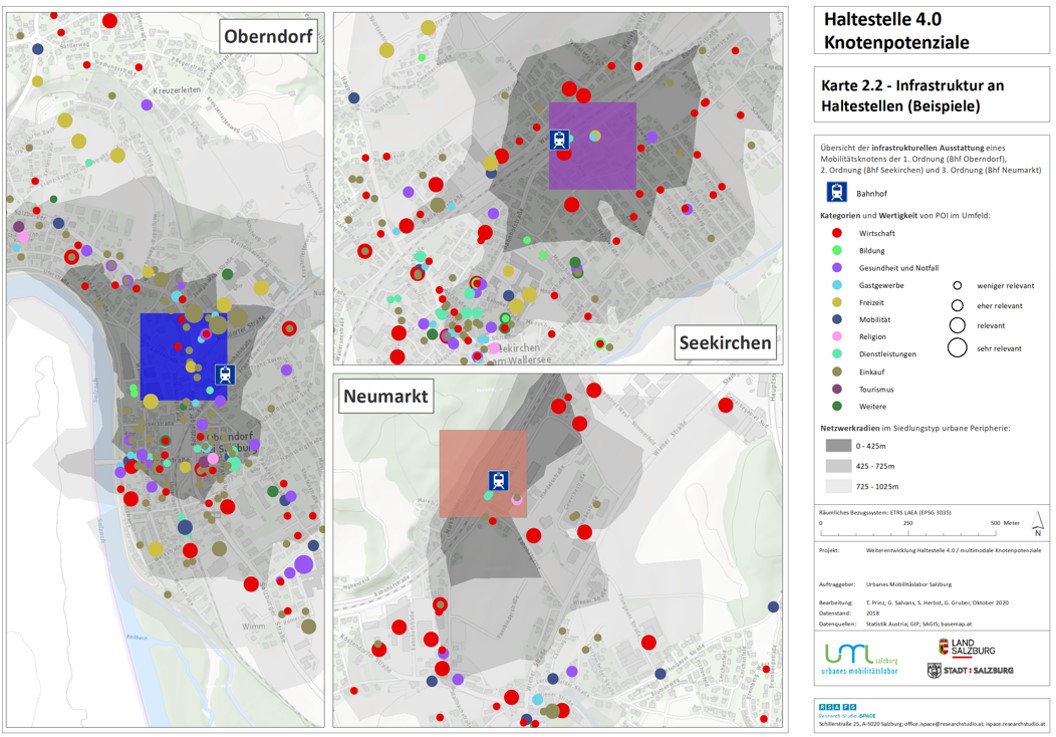
POIs per station tool results on a map.
Additionally, other Python extensions for GIS were developed in order to automatize all kind of spatial data processing processes. In a nutshell, GIS Development
is the best suitting title for my internship at iSPACE.
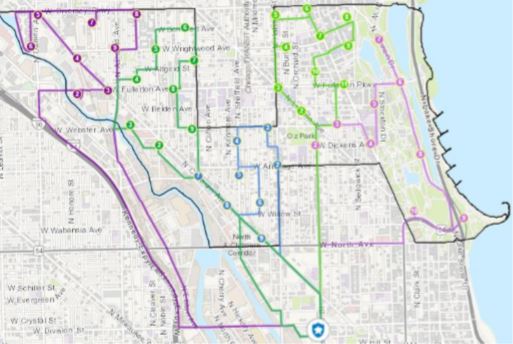
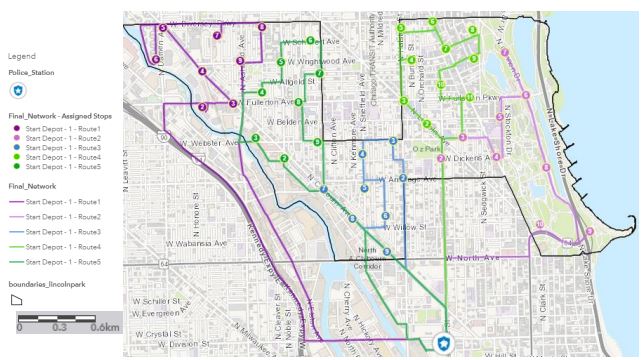
Multi-stop route planning:
Application of Dijkstra’s Algorithm on the night
criminal activity of Lincoln Park (Chicago, IL)
Seminar project of the course SE Analysis and Modeling.
Project Abstract
This project focuses on a multi stop route planning method (Dijkstra algorithm) and
implements it within an empirical use case framework. While going through the main
principles of this network analysis subfield such as the Graph Theory, this research
follows the entire multi stop route planning analysis workflow. This includes data
collection and storing, data management and preparation, analysis, exposure and
discussion of the outcome: a night police patrol network based on crime data of Lincoln
Park (Chicago, Illinois).
Topic Introduction
Network analysis as a very broad spatial analysis area, can be applied and give optimal
solutions in multiple situations; basically, all the scenes that involve a network such as
logistics, telecommunications, traffic, etc., can be study objects or inputs for this tool.
Just by having some nodes or points, a route or even an entire network can be built from
scratch in order to solve basic daily needs in a population. According to that and together
with a strong interest in mobility planning, this seminar project is going to be based on
multi stop route planning. However, it is still a very broad method and therefore, there
is the need to further specify the interest of having chosen such a multifaceted topic.
Following this line, this project deals with crime data as an input to create a night police
patrolling network for a specific geographical area: the Lincoln Park neighborhood
(Chicago, Illinois). A city which has been categorized as one of the areas with the most
criminal activity in the United States and which is currently presenting a dynamics
change in the spatial distribution of its crime. Residential areas from the north side of
the city, like Lincoln Park or Lake View, have been experiencing a very strong increase in
their felonies during these past years. In numbers, during 2019, crime rate in Lincoln
Park increased by 40% in comparison to 2018 and a considerable part of these
phenomena take place at night (Cseke , 2020). Taking this into consideration, a need has
been identified: the security improvement of these areas and consequently, the
contribution to the fight of Chicago against the crime.
This exposed situation, as many of the current daily problems, can be minimized and
optimized by using geospatial solutions. In this case, the personal passion for the smart
(mobility) planning brought the author to look forward to use network analysis tools in
order to solve a current social need. In other words, a potential smart solution is going
to be created –a police patrol network- based on crime cores of the specific study area,
with the aim of giving a tool which will minimize the night criminal activity in the
neighborhood of Lincoln Park.
Workflow Overview
The data used is the key part and main
input of this entire project. According to this, these are the used datasets:
- Vector data of the Chicago neighborhoods.
- Point data of the crimes in Chicago during the whole 2019 (256.879 records).
Both datasets were extracted from the Chicago Data Portal . On one hand, the vector data was queried for the
specific study area (Lincoln Park). On the other hand, the crime data was clipped
according to the study area as well. Additionally, this crime data was also queried
with the time span (21h-6h), so the night felony areas could be perfectly identified.
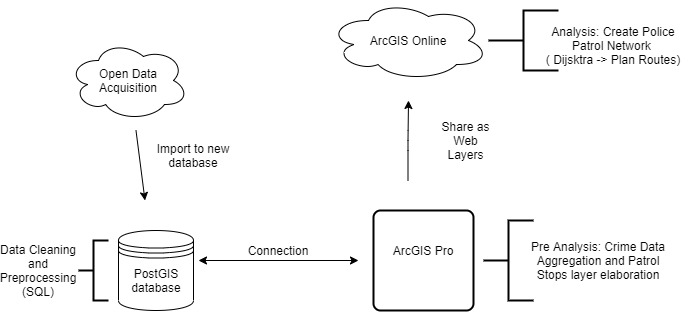
In terms of software tools, the data conversion (from JSON/CSV to SHP or any type of
spatial file format) was carried out with QGIS and imported right away to a local database
(PostgreSQL) which stored all the data in order to smoothen the data cleaning and
management process throughout SQL. Once this was set, a connection with the database
was done in ArcGIS Pro and the pre-analysis phase was able to start (data
preparation for the analysis – e.g. nodes allocation). After this, the analysis itself was
carried out within the ESRI cloud based GIS environment (ArcGIS Online).
Results
According to this image above, an optimal network of five routes throughout the Lincoln
Park neighborhood was established. Taking into consideration the Dijkstra Algorithm workflow, each single network edge (or road) has been
automatically selected depending on travel time and therefore, all the routes have been
generated.
Introduction to Data Science and Machine Learning for Geospatial Data
Final Assignment: Predicting Hurricane speed movements
Final Assignment of the course Introduction to Data Science and Machine Learning for Geospatial Data.
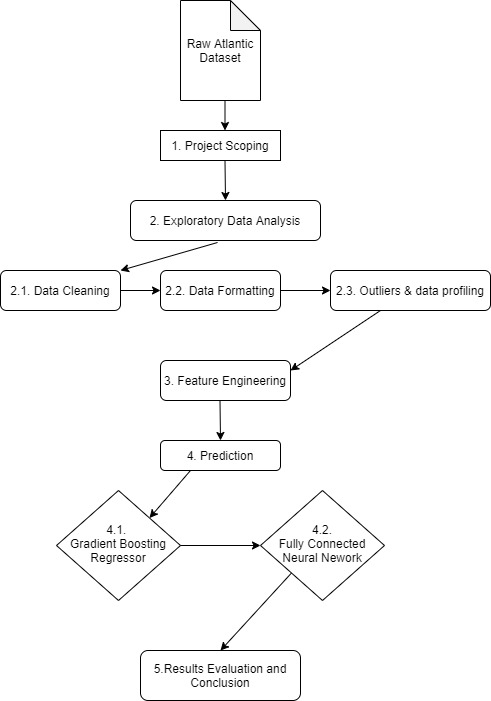
This project uses historical hurricane data from the NHC (National Hurricane Center) which covers hurricane movements every 6h in the Atlantic from 1851 until 2015 -for further information about the data checkout the metadata.pdf (under /src)-. The main target of this study case is to predict the average speed of the next hurricane movement. The predicted speed corresponds to the average speed movement of the hurricane in the next 6 hours. To do so, a Machine Learning technique (Gradient Boost Regressor) and a Neural Network approach (Fully Connected NN) are applied in order to see differences between methods and compare performances. Once the prediction problem is solved, an evaluation of the results and assessment of both methods is carried out.
See the full assignment on my GitHub repository.
Team: Gil Salvans Torras
Completion date: March 2021
Machine Learning and Data Science for Social Good
Final assignment of the course Machine Learning and Data Science for Social Good (21S856137).
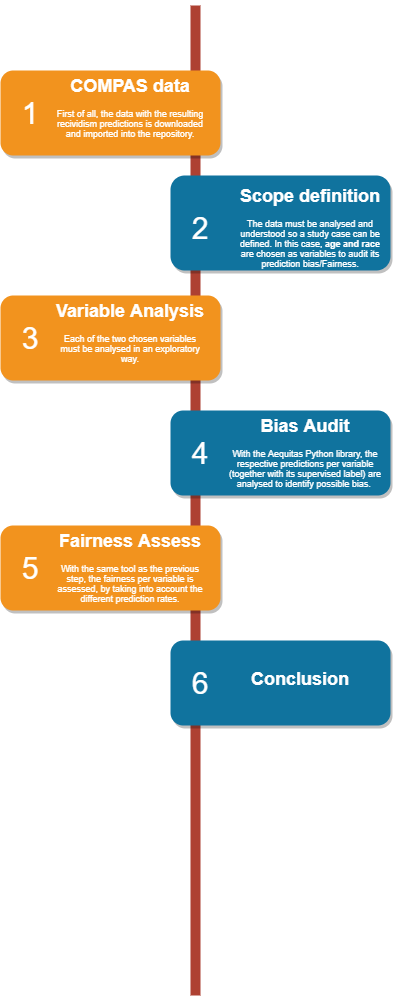
Assessing bias and fairness in the COMPAS Recidivism Risk dataset: Study case for Age and Race
This project takes as input the COMPAS dataset ( https://www.propublica.org/datastore/dataset/compas-recidivism-risk-score-data-and-analysis ), which contains the criminal history, jail and prison time, demographics and COMPAS risk scores for defendants from Broward County from 2013 and 2014. This data has already been subject to a classification on the risk scores. Its results represent whether each criminal has a low, medium or high recividism risk. Criminals with high and medium risks are considered that will be charged with a felony or misdemenor in the two years after administation of COMPAS assessment. Low is considered a prediction of non-recidivism. This is based on ProPublica's interpretation of Northpointe's practioner guide.
With this, the aim of this assignment is to assess bias and fairness in this resulting dataset. In this case, on one hand, age, and on the other hand, race, will be the two taken inputs to assess potential prediction biasses. Especially the comparison between the two differantiators (age and race) is interesting. As a society of course we agree that race is not something that criminal decisions should be based on and is therefore an inherently unfair characteristic. Age on the other hand affects all humans the same, therefore it seems like people accept that different age groups are treated differently. Applying the same workflow to both characteristics can show how by metrics alone something can be unfair that most people would not consider unfair.
To do so, the Python library from Aequitas (https://github.com/dssg/aequitas) will be the main instrument used for this analysis (besides other Python libs for data manipulation -see notebook in the repository-).
End of term assignment of the course Practice in Software Development.
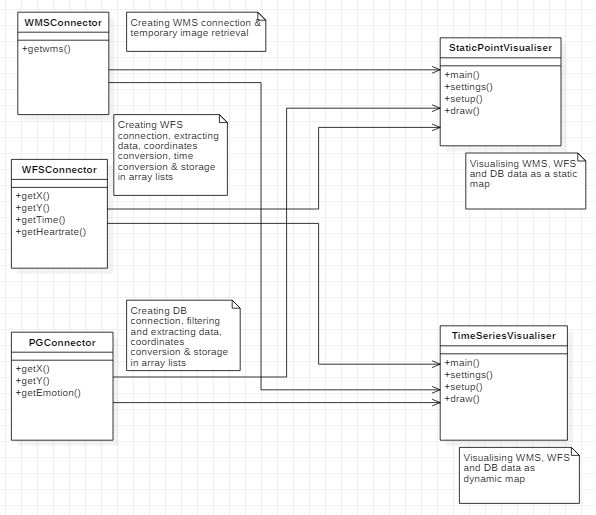
Object-Oriented Time Series Visualization in Processing
The goal of this End-of-Term Assignment is the development of Java classes (within a Java package), which
display data from two different sources (PostgreSQL database table and OGC WFS data) statically and
dynamically by using the Processing library.
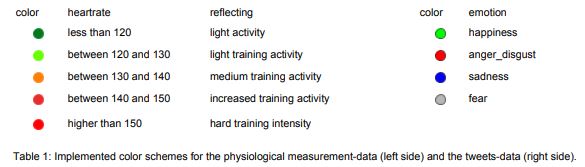
The PostgreSQL database-table stores Tweets data, including time, coordinates and keywords related to the
sentiment of the message (happiness, anger, disgust). The WebFeatureService-Connection allows to access
data from physiological measurements of a cyclist including the measured heart-rate as well as the geographic
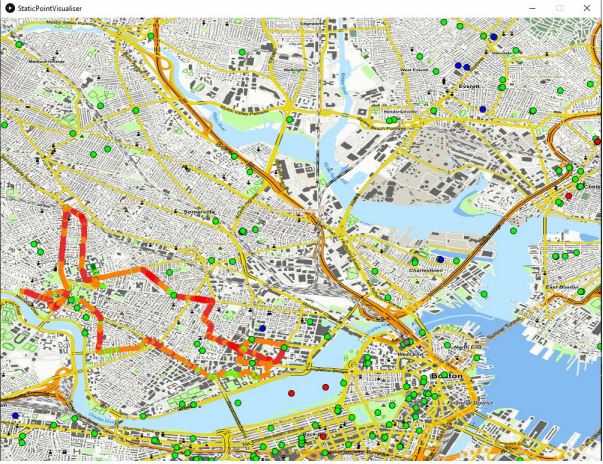
position of the bicycle rider and the time. The desired outcome is a TimeSeries-class, that displays a cyclist
moving along Boston while showing his heart-rate and twitter data popping up related to the user’s feeling.
Design
We decided to design our project with three classes that connect to the different data sources and preprocess
the data, and one additional class, which deals with the preprocessed data and displays it on a map. The last class is available in two versions; a static and a dynamic version.